Investors


XPS Group, a FTSE 250 company, is a leading UK consulting and administration business specialising in the pensions sector and providing wider ranging support to insurance companies in the life and bulk annuities sector.
We are a forward-looking, ambitious business providing the best place for people to work and the best partner for our clients. Our objective is to be the pre-eminent UK focussed pensions consulting and administration firm.
Diversified and stable client base
We have long-standing relationships with a large and diverse client base, consisting of over 1,300 clients. We have a strong brand and have won multiple industry awards for our client service.
1,300+
clients
Top ten clients represent
20% of revenue
Benefit from regulatory and market change
There are c.£1 trillion of liabilities of private UK defined benefit pension schemes and a rapidly growing defined contribution market. Regulatory developments are driving increased client activity and demand for our services.
>£2.5bn
size of annual fee market
Track record of profitable revenue growth
XPS has delivered year on year profitable revenue growth, through a range of macroeconomic conditions, since listing on the London Stock Exchange.
14%
five-year revenue CAGR
Trusted expertise and highly engaged colleagues
The outstanding expertise and client service focus of our colleagues are widely relied upon and highly valued by our clients. We have high client satisfaction scores and our people think XPS is a great place to work.
90%
of our people
think XPS is a great
place to work
Non-cyclical and recurring revenues with inflation linkage
Our services are typically provided on the basis of an open-ended engagement with clients and are compliance driven to a statutory timetable. They are, therefore, required in all parts of the economic cycle. We have a high degree of visibility of our revenue.
c.90%
repeat recurring revenue
across the business
Strong cash conversion and growing dividends
XPS has a robust balance sheet, consistently high cash conversion and a progressive dividend policy. Since listing in 2017, £138 million has been paid in dividends.
91%
operating cash flow conversion
Opportunities for earnings enhancing M&A and scale up
We have a proven track record of successful earnings enhancing M&A which demonstrates our ability to execute deals that are aligned to our corporate strategy.
7
acquisitions
since listing in 2017
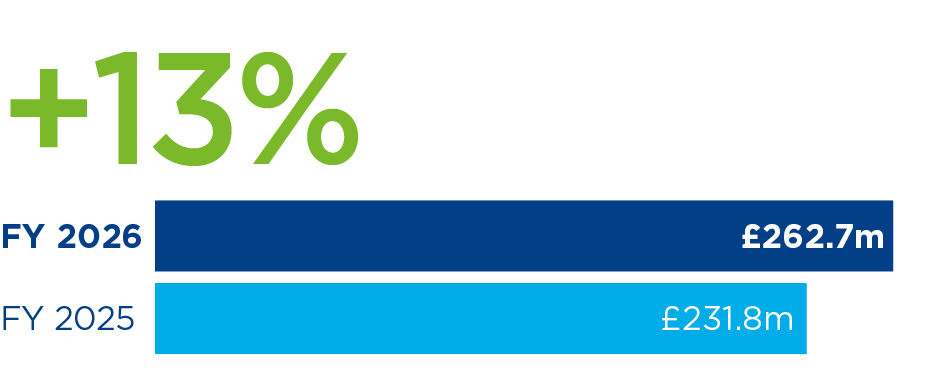
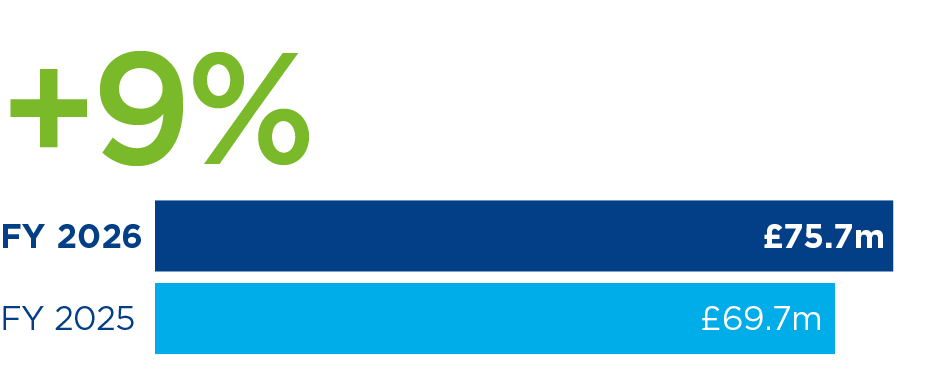
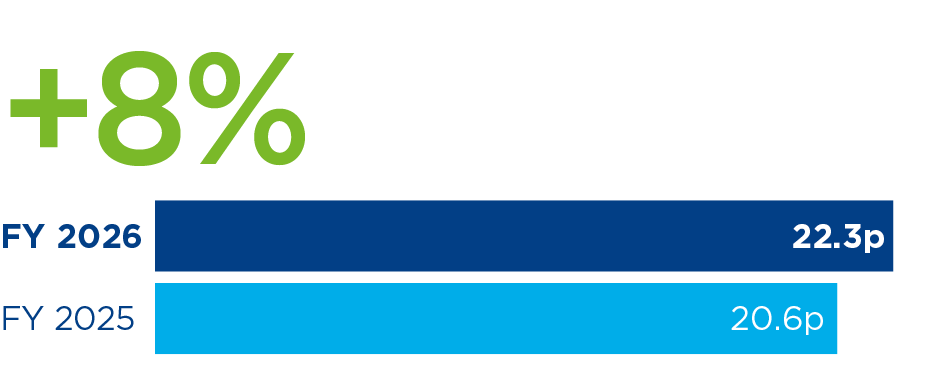
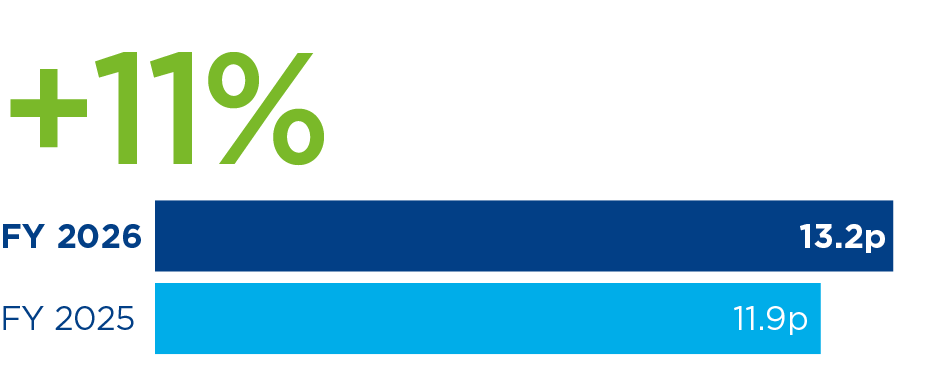
Financial highlights
Revenue
Adjusted EBITDA1
Adjusted diluted earnings per share2
FTE employees3

Proposed full year dividend
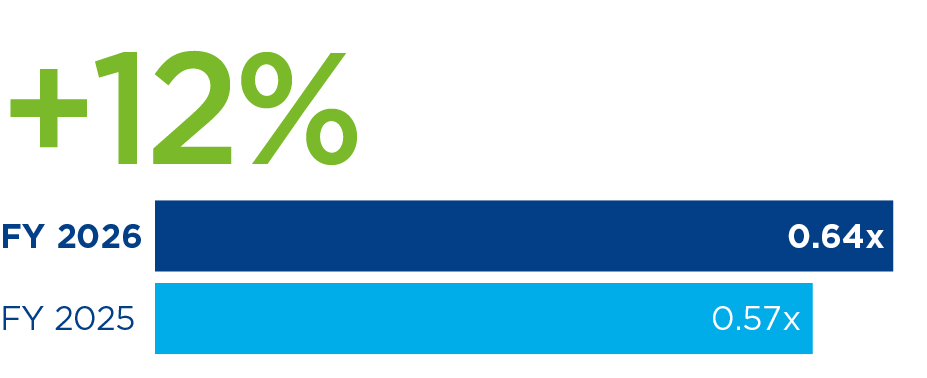
Net debt/adjusted EBITDA4
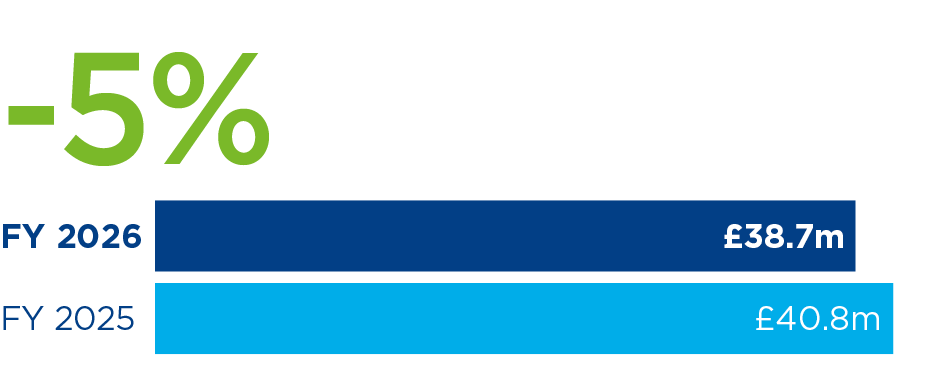
Profit before tax
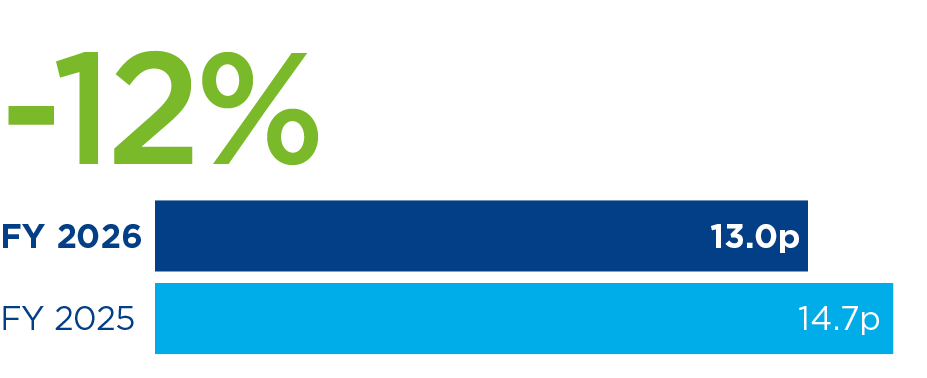
Basic earnings per share
- Adjusted EBITDA excludes the impact of exceptional and non-trading items (see note 5 in the financial statements). See table 1 in the appendix to the Chief Financial Officer’s Review for more detail.
- Adjusted diluted earnings per share is based on adjusted profit after tax, which excludes the impact of exceptional and non-trading items and the tax impact of these items (see note 5 in the financial statements). Also see table 3 in the appendix to the Chief Financial Officer’s Review.
- As at year end.
- For banking covenant purposes, net debt is the drawn revolving credit facility less cash held. This includes any amount owed as contingent consideration, but excludes lease liabilities.
Five year summary
| 20228 | 2023 | 2024 | 2025 | 2026 | |
|---|---|---|---|---|---|
| Revenue | |||||
| Advisory1 | 75.9 | 95.4 | 113.7 | 125.5 | 150.1 |
| Administration | 52.3 | 57.5 | 71.9 | 93.7 | 98.7 |
| SIP | 6.1 | 9.4 | 11.0 | 12.6 | 13.9 |
| NPT | 4.3 | 4.3 | 2.8 | 0.0 | 0.0 |
| Total revenue | 138.6 | 166.6 | 199.4 | 231.8 | 262.7 |
| Adjusted EBITDA2 | 34.1 | 42.4 | 55.3 | 69.7 | 75.7 |
| Profit before tax3 | 16.9 | 19.1 | 62.5 | 40.8 | 38.7 |
| Adjusted diluted EPS (pence per share)4 | 10.2 | 12.6 | 15.3 | 20.6 | 22.3 |
| Basic EPS (pence per share)5 | 4.6 | 7.7 | 26.2 | 14.7 | 13.0 |
| Full year dividend (pence) | 7.2 | 8.4 | 10.0 | 11.9 | 13.2 |
| Net debt6 | 54.6 | 55.3 | 14.0 | 40.3 | 46.2 |
| FTE Employees7 | 1,442 | 1,570 | 1,712 | 1,901 | 2,024 |
All figures in millions of £'s unless otherwise stated
- Advisory previously split out into Actuarial and Consulting, and Investment Consulting. The work done by this team now includes Insurance consulting, and has now all been combined to present one figure for Advisory.
- Adjusted EBITDA excludes the impact of share-based payment costs, fair value adjustments of contingent consideration, and exceptional costs.
- Profit before tax for FY24 includes the gain on disposal of the NPT business of £32.5m.
- Adjusted diluted earnings per share is based on adjusted profit after tax, which excludes the impact of amortisation of intangible assets, share-based payment costs, fair value adjustment of contingent consideration, exceptional costs and the gain on disposal of NPT business, as well as the tax impact of these items.
- Basic earnings per share in FY24 includes the impact of the gain on disposal of the NPT business of £32.5m (equivalent to 15.7 pence per share).
- Net debt excludes lease liabilities.
- As at year end.
- Revenue re-statement between Pensions Actuarial & Consulting and Pensions Administration.
Latest document

| 09 Jul 2026 |
| Annual Report and Accounts 2026 |
| View |
| View ESEF XHTML |
| Download ESEF ZIP |
| Visit |
Investor calendar
|
21 August 2026 Final dividend record date |
|
21 September 2026 Final dividend payment date |
Shareholder information
Key information for shareholders such as contact details, AGM documents and our investor calendar.
Analyst coverage and consensus

Corporate governance
At XPS we are committed to operating with good corporate governance and in compliance with the UK Corporate Governance Code 2018.
- Register for events
- Join our mailing list
Register for events
We enjoy hosting a wide range of events for pension scheme trustees, corporate sponsors, independent trustees, and pensions professionals.
Join our mailing list
Keep up to date with our latest news and views including pension briefings, XPS insights, reports and event invitations.